
MISD earns C rating, 75 overall in state performance score
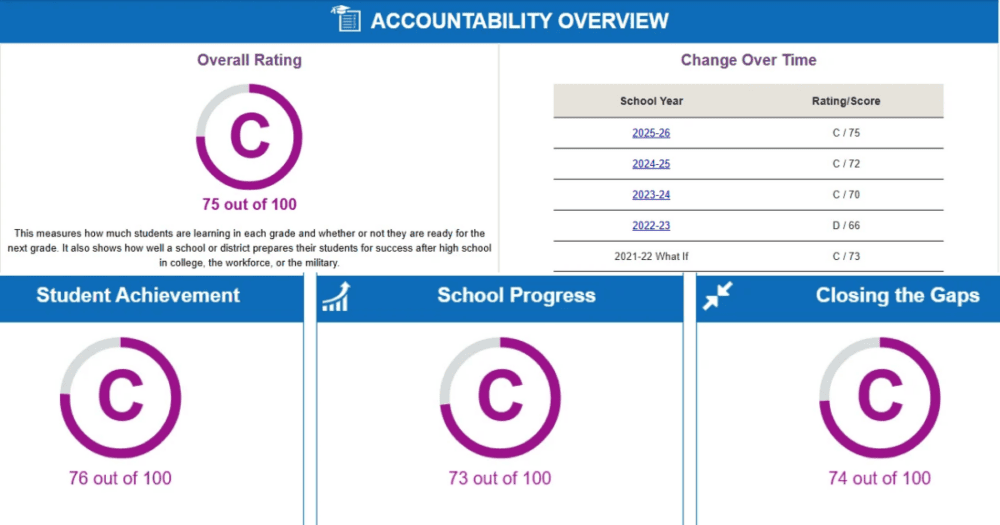
What happened: Midland ISD earned a district-wide C rating with an overall score of 75 in the Texas Education Agency’s (TEA) preliminary 2026 accountability ratings, up from a 72 in 2025, a 70 in 2024, and a 66 (a D) in 2023.
Fifteen MISD campuses earned an A or B this year, up from 14 last year. Meaning, of the 39 campuses rated, roughly 39% are A or B campuses. Nineteen campuses (roughly 49%) are C-rated, up from 15 last year. Five campuses (roughly 13%) are D- or F-rated, all elementary schools, down from nine last year.
Why it matters: The A–F scores show where schools are improving and where challenges remain. Under board policy, MISD posts each campus’s report at the campus entrance and in the principal’s office and emails it to parents and guardians. Also, the report at every campus is color-coded green or red. Green for matching or beating last year’s numeric score. Red for any decline in overall performance or individual domain.
The big picture: The ratings measure three domains. Student Achievement measures what students know, including STAAR results, as well as graduation rates, and college, career, and military readiness at the high schools. School Progress measures campuses’ year-over-year student growth. Closing the Gaps scores how economically disadvantaged students, special education students, and English learners perform against state targets.
| 2023 | 2024 | 2025 | 2026 | |
| MISD Overall Grade | 66 (D) | 70 (C) | 72 (C) | 75 (C) |
| Student Achievement | 69 | 71 | 73 | 76 |
| School Progress | 69 | 69 | 73 | 73 |
| Closing the Gaps | 60 | 69 | 71 | 74 |
Elementary campus ratings, 2023–2026
Of the 27* campuses with year-over-year ratings, 17 (63%) increased or stayed the same, while ten (37%) decreased.
| Campus | Trend | 2026 | 2025 | 2024 | 2023 |
| Carver | ▲ | A (98) | A (97) | A | A |
| Bowie | — | B (88) | B (88) | B | B |
| Bush | — | B (87) | B (87) | B | C |
| Greathouse | ▲ | B (87) | B (85) | B | C |
| Milam | ▲ | B (86) | C (78) | B | C |
| Bonham | ▲ | B (85) | B (80) | D | C |
| Scharbauer | ▲ | B (85) | B (84) | C | F |
| Sam Houston | ▼ | B (84) | A (91) | C | C |
| Fasken | — | B (83) | B (83) | B | B |
| Pre-K Academy | ▲ | B (83) | C (72) | C | D |
| De Zavala | ▲ | B (82) | D (68) | F | F |
| Franks | ▲ | B (80) | C (78) | C | C |
| Pease | — | C (78) | C (78) | B | D |
| Fannin | ▼ | C (77) | C (79) | B | C |
| Parker | ▼ | C (76) | B (87) | B | C |
| Santa Rita | ▼ | C (76) | B (84) | B | C |
| Emerson | ▲ | C (75) | C (73) | C | C |
| Rusk | ▼ | C (74) | B (83) | A | C |
| Burnet | ▼ | C (73) | C (74) | C | F |
| Jones | ▲ | C (72) | D (65) | D | F |
| Bunche | ▲ | C (72) | D (64) | F | F |
| IDEA Travis | ▲ | C (71) | D (66) | D | D |
| Lone Star Trails | new | C (70) | — | — | — |
| Yarbrough | ▼ | D (68) | C (73) | C | B |
| Lamar | ▼ | D (65) | C (74) | B | F |
| South | ▲ | D (65) | F (59) | B | D |
| Long | ▼ | D (61) | C (71) | D | F |
| Henderson | ▼ | F (59) | C (76) | F | F |
*Lone Star Trails received its first rating this year.
Junior High campus ratings, 2023–2026
Of the six campuses rated, five (83%) increased or stayed the same, while one (17%) decreased.
| Campus | Trend | 2026 | 2025 | 2024 | 2023 |
| YWLA | ▲ | A (97) | A (96) | A | A |
| Goddard | ▲ | C (79) | D (62) | F | D |
| Abell | ▲ | C (75) | D (69) | F | D |
| Alamo | ▲ | C (74) | D (62) | D | F |
| San Jacinto | ▼ | C (74) | C (77) | C | C |
| IDEA Travis | ▲ | C (71) | D (66) | D | D |
High School campus ratings, 2023–2026
Of the eight campuses rated, six (75%) increased or stayed the same, while two (25%) decreased.
| Campus | Trend | 2026 | 2025 | 2024 | 2023 |
| Early College | ▲ | A (99) | A (98) | A | A |
| YWLA | ▲ | A (97) | A (96) | A | A |
| Coleman | ▲ | A (92) | B (88) | C | B |
| Legacy Freshman | ▲ | C (76) | D (61) | D | C |
| Midland High | ▲ | C (75) | C (73) | D | D |
| Midland Freshman | ▼ | C (73) | C (74) | C | C |
| Legacy High | ▼ | C (73) | C (74) | C | D |
| IDEA Travis | ▲ | C (71) | D (66) | D | D |
Go deeper: The five elementary campuses rated D or F — Henderson, Lamar, Long, South, and Yarbrough — are all on TEA’s consecutive unacceptable tracking file. Henderson and South have one consecutive year of academic unacceptability. The other schools are zero consecutive years.
Under state law, a campus rated unacceptable for five consecutive years forces the TEA commissioner to either order the campus closed or hand the entire district to a state-appointed board of managers. Before it reaches that point, the state both mandates and offers districts a series of interventions, including improvement plans, state-assigned intervention teams, turnaround plans, and potentially turning the campus over to an outside operator.
What’s next: Campus-level report cards are available at TXschools.gov. The TEA will accept district appeals this fall and finalize the ratings in December.