MISD spending rises as “Robin Hood” complaints continue
What happened: Midland ISD elected officials often allude to local funding recapture by the state, or more commonly known as “Robin Hood,” as a major constraint on the district’s ability to improve outcomes. But recapture is also a long-standing feature of Texas school finance, and one that is unlikely to disappear.
Why it matters: Recapture has been part of Texas for more than three decades, and remains one of the most discussed yet least understood parts of school finance. In a recent KWEL interview, Keith Stretcher, a longtime West Texas attorney, explained how the system works, why it’s unlikely to change, and what it means for local taxpayers.
At the same time, MISD elected officials recently discussed Robin Hood in relation to the school district’s current $508 million budget. Rather than focusing on how much funding the district might retain without recapture, the more relevant question is whether the district is effectively using the dollars it already collects.
The big picture: Recapture was created in 1993 as part of Texas’ effort to equalize school funding between property-rich and property-poor districts. The state sets a per-student funding entitlement that districts must first fund through local property taxes. If local collections exceed that entitlement, the excess is subject to recapture and returned to the state. Midland ISD has fallen into that category in the last decade.
Stretcher noted that in a 2016 decision, the Texas Supreme Court upheld the system and declined to take further cases challenging it, effectively leaving any potential future changes to the state Legislature. Stretcher noted 241 Texas public ISDs currently pay into the recapture system, while 798 receive recapture funding. He noted the uphill battle it would take to convince Legislators tied to those districts to abandon that money.
Robin Hood is a real constraint on paying districts, but it is not a complete explanation for the district’s growing financial footprint. Midland ISD is operating with significantly more per-student funding today than in the past, even after accounting for inflation, raising a fundamental question: how much funding is actually required to deliver better outcomes?
Go deeper: Stretcher noted that before local property values increased in Midland, the district received recapture funding from the state for several years, then eventually became a paying district as mineral values rose, likely beginning in the mid-2010s. District data show payments peaked at approximately $164 million in 2022–23. Midland ISD’s 2025–26 budget estimates their recapture payment at around $64.8 million.
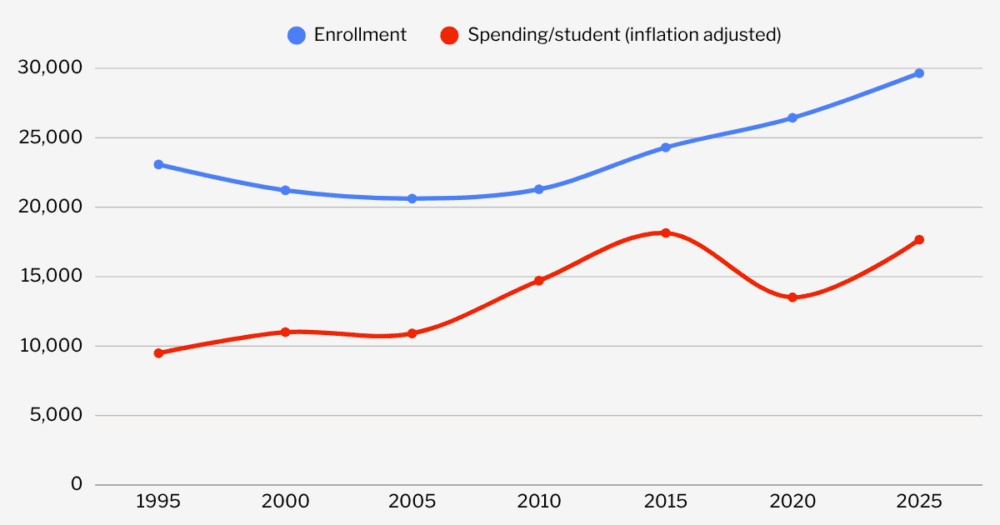
While still substantial, that decline occurred during a period when per-student spending increased sharply. In 1995, shortly after Robin Hood began, MISD spent about $4,490 per student. Adjusted for inflation, that is roughly $9,500 in today’s dollars. By 2025, the district is budgeting $17,658 per student. Even after accounting for inflation, that represents an increase of more than 80 percent.
Enrollment has not grown at the same pace. The student population has increased by about 28 percent since 1995, while real per-student spending has risen much more quickly. More recent trends show a similar pattern. From 2020 to 2025, enrollment increased by about 12 percent. After adjusting for inflation, per-student spending from 2020-2025 still increased by roughly 30 percent.
← On mobile: scroll to view full table →
| Year | Students | Spending | Spend per student | Recapture | Spend/student (2025 $) |
|---|---|---|---|---|---|
| 1995 | 23,074 | $103.6M | $4,490 | — | $9,490 |
| 2000 | 21,215 | $124.8M | $5,885 | — | $11,000 |
| 2005 | 20,621 | $137.9M | $6,620 | — | $10,913 |
| 2010 | 21,287 | $212.5M | $9,960 | — | $14,705 |
| 2015 | 24,300 | $324.5M | $13,353 | $32.3M | $18,138 |
| 2020 | 26,432 | $286.6M | $10,860 | $139.1M | $13,509 |
| 2025 | 29,651 | $522.7M | $17,658 | $88.8M | $17,658 |
What they’re saying: MISD Board President Josh Guinn recently described the district’s recapture position this way:
“Projected $83 million, send it back to the state this year, but in return, they’re going to give us right under $34 million back in funds,” Guinn said. “But then we’re going around telling everybody that it’s the local municipalities that are raking the coals over the taxpayers.”
The bottom line: Focusing too heavily on money sent to the state risks obscuring how much funding the district already controls and how it chooses to use it. District leaders must decide whether the conversation should continue to center on what is lost or shift toward how the district manages what it has.
What’s next: Gov. Greg Abbott has proposed several approaches to property tax relief, including eliminating the school district maintenance and operations (M&O) tax and replacing it with state-level funding. Such a change would effectively dismantle the current recapture system, but it would require major legislative agreement and a long-term funding replacement.
School districts’ ballooning budgets could also be reined by adopting his proposal to limit spending growth to the lesser population plus inflation or 3.5 percent. This type of cap does not determine how much a district should spend per student, but it does provide a benchmark for evaluating whether spending growth is outpacing underlying demand.
Here’s a look at how MISD’s budget growth would compare under that framework, using 1995 as a baseline:
← On mobile: scroll to view full table →
| Period | Enrollment trend | Inflation trend | Allowed annual growth used | Potential budget | Actual budget |
|---|---|---|---|---|---|
| 1995 → 2000 | down slightly | moderate | 0.8% | $107.8M | $124.8M |
| 2000 → 2005 | down slightly | moderate | 2.0% | $119.0M | $137.9M |
| 2005 → 2010 | up slightly | moderate | 2.9% | $137.0M | $212.5M |
| 2010 → 2015 | up faster | modest | 3.5% cap | $162.8M | $324.5M |
| 2015 → 2020 | up moderately | modest | 3.47% | $193.0M | $286.6M |
| 2020 → 2025 | up moderately | high | 3.5% cap | $229.3M | $522.7M |